Written by the TreasureGuide for the exclusive use of the Treasure Beaches Report.
 |
| Cone For Tropical Depression Thirteen. Source: nhc.noaa.gov |
 |
| Speghetti Models for Tropical Depression 13 Source: nhc,noaa.gove |
The GEM model shows it hitting around West Palm beach as a fairly strong storm about 8 PM Tuesday. That could cause a lot of erosion on the Treasure Coast as well as some wind damage to property.
 |
| GEM Model Showing Tropical Depression 13 Just Off Shore Tuesday. Source: Ventusky.com. |
 |
| Source: nhc.noaa.gov |
Here is an article about Le Trinitie and archaeologists against treasure hunters.
“La Trinité is a ship tied to the history of three nations—France, Spain, and the United States,” explains noted maritime archaeologist James Delgado, the senior vice president of SEARCH, a U.S.-based cultural resources organization with offices in Jacksonville, Florida, and a specialty in archaeology. Delgado has participated in over 100 shipwreck investigations around the world and is the author of over 200 academic articles and dozens of books. “It tells a story of fortunes, empires, and colonial ambition that carries an international, shared cultural heritage.”
Here is the link for the entire article.
Thanks to Nick A. for that link.
---
Just like predicting storms, science in general is very much about statistics and probabilities and confidence levels.
I talked a lot about signal detection theory and the different types of errors. The NHC cone of uncertainty, or whatever you call it, acknowledges error and degrees of uncertainty. I wish the health agencies acted more like that.
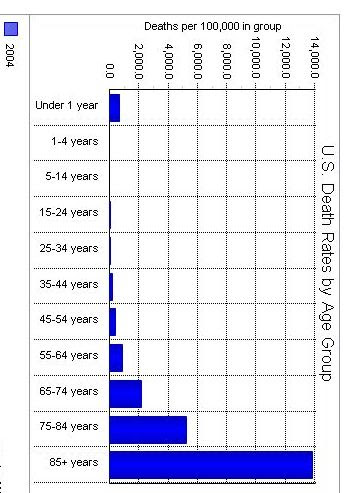
The following chart shows death rates for various age categories for the year 2004. Somewhere I saw tables for 2017 and 2018 which were very similar.
Of course we already knew that older people tend to die, but this gives some proportion to it.
Below is a chart I saw a few days ago on the Florida Dept. of Health web site showing the current (at that time) St. Lucie County statistics.
Notice in particular the last column, which shows almost the same shape distribution for Covid patient deaths as the shape of the distribution of death rates for the various age groups of the general population (Covid and non-Covid). I'm actually surprised by how similar the increase in death rates is for the various age groups and would like to do additional analysis but don't have access to good data - if it exists at all.
Taking the 85 and older age group for example, 36% of the Covid cases die, while in the total 85 and older population (including both healthy and not), 14% die. Elderly Covid patients die at a higher rate, but how much more than other patients, such as cold, flu or other illnesses? Would be interesting if good accurate data was out there.
We don't know the validity and reliability of the tests. The data is not coded consistently, and isn't reported accurately and systematically. For example, three test centers in the Orlando area, were reporting only positive tests, which would, of course, skew the data. It has also been reported that if you die from something like a motorcycle accident and have Covid you are counted as a Covid death. Of course that makes no sense. We should know how the data is collected in order to know how to interpret it. Furthermore, the same people are take the test multiple times with varying results.
We get better information from the weather services than the health agencies.
---
Keep watching tropical depression 13. There is still a chance our beaches will get hit next week.
Happy hunting,
TreasureGuide@comcast.net

